The Problems of the Traditional Deterministic DCF
A deterministic⁽¹⁾ DCF uses deterministic forecasts which are driven by only one scenario of variables. Valuators normally analyse forecasts using three scenarios: optimist, pessimist, and mean or they use sensitivity analysis. However, such approaches do not work with multiple variables that change in time. Additionally, deterministic forecasts and valuations
are not able to simulate volatilities and probabilities of the variables driving a business. The lack of probabilistic and volatile driven forecasts causes valuations to miss valuable information for decision making. In particular, deterministic systems cannot correctly model the following cases:-
- Businesses dealing with volatile commodities.
- Start ups where probabilities of success are low.
- When a proxy for risk that can be used to obtain discount rates are not available.
- Businesses located in emerging countries with volatile economies, currencies, and inflation.
- Businesses dealing with the probabilities of discovering natural resources.
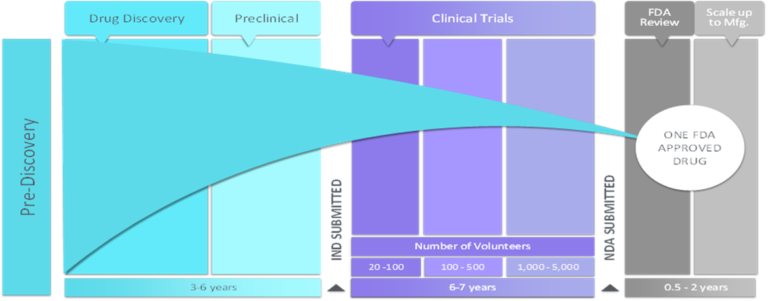
- Pharmaceutical and Biotech firms in which clinical trials of new products takes years with four or five phases
in with probabilities of approval may be low. - All businesses and open economies where their internal environments are affected by random events.
(1) Simulation models that contain no random variables are classified as deterministic. Deterministic models have a known set of inputs which will result in an unique set of outputs. A stochastic simulation model has one or more random variables as inputs. Random inputs lead to random outputs. Since outputs are random, they can be considered only as estimates of the true characteristics of a model. In a stochastic simulation, the output measures must be treated as statistical estimates of the true characteristics of the system.
Advanced & Stochastic Valuations
Advanced valuations use stochastic or random processes which is a probability model used to describe business phenomena that evolve over time. More specifically, in probability theory, a stochastic process is a time sequence representing the evolution of business variables / drivers whose change is subject to a random variation (Models containing a random element, hence unpredictable and without a stable pattern or order).
Most businesses and open economies are stochastic systems because their internal environments are affected by random events. Such situations need to be measured using probabilities, volatilities and standard deviations according to the profile of each variable under assessment. On the contrary, traditional valuations are deterministic (or non-stochastic) and therefore they are far from reflecting reality and not able to show you the flow of your business.
One of the advantage of a stochastic model is that such a model more accurately characterizes the unpredictable nature of any business. It also helps to ensure that observed results are not unduly biased by the particular choice of events in a given scenarios.
Advanced Valuation Process and Steps
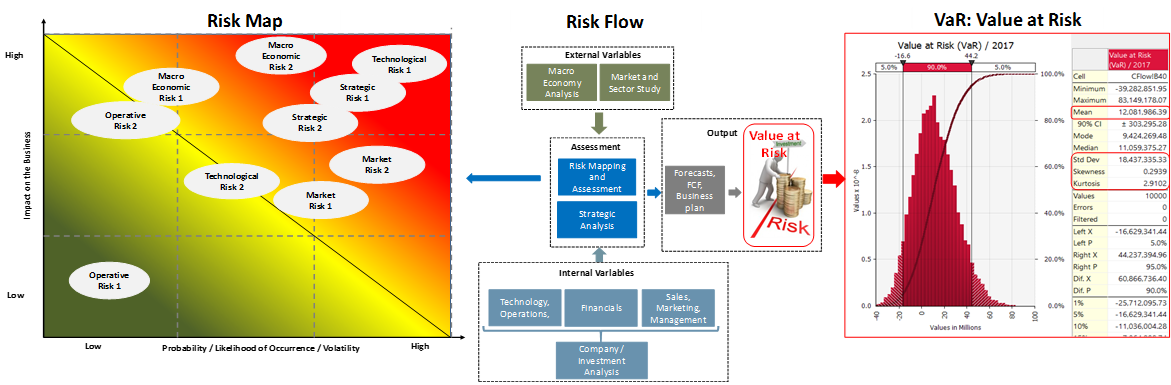
As shown in the figure below, an advanced valuation have the following steps:-
1. Identification of value-risk drivers (after market and company analysis).
2. Identification of the risk-profile of the drivers affecting the business:-
• It could be a probable event including market and strategic forces.
• It could be a variable subject to volatility.
3. Measurement of value-risk drivers (based on market and statistical studies). Measurement of probabilities, volatilities,
evolution over time of several different patterns, etc.
4. Analysis of the Risk flow: How drivers are related (cause and effect) and affect the final forecasts.
5. Model design and construction.
6. Running the model.
7. Final Analysis and interpretation of the Value at Risk (VaR) and stochastic forecasts.
Why an Advanced Valuation
1. To identify and understand the value drivers of a business in the long term.
2. To measure the impact of the risks affecting the company in the mid and long term.
3. To create realistic and unbiased valuation models using uncertainty / predictive analysis.
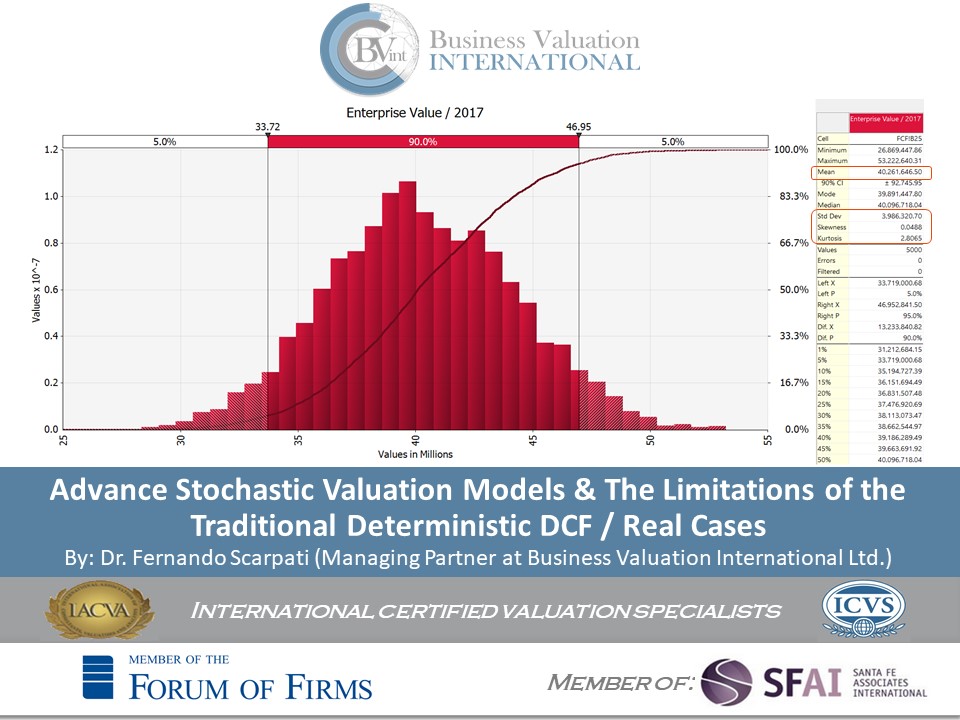
4. To calculate the VaR (value at risk) and analyse the value of the company in the light of a probabilistic distribution
which includes all possible scenarios that its drivers may generate.
5. To mitigate the business risk and develop a strategic value creation plan.
6. To make sure the company’s strategy is capturing the best opportunities the markets are offering.
7. To review the strategy and business model in the light of the fast changing markets.
8. To evaluate all the possible impacts of each drivers on the value of the company.
9. To take strategic decisions
Monte Carlo Simulation and Its importance in Valuation
Monte Carlo simulations are used to model the probability and volatility of different outcomes in a process that cannot easily be predicted due to the intervention of random variables. Since business and finance are plagued by random variables, Monte Carlo simulations have a vast array of potential applications in these fields. They are used to assess the risk that an entity will default and to analyze derivatives such as options. Insurers and oil well drillers also use them. Advanced Valuations also use them to assess all risks and variables driving the value of companies and investments. Sample of uncertain variables assessed by an advanced stochastic valuation:-
– Currency risk
– Interest risk
– Credit risk
– Probable contingencies and events,
– Commodity prices,
– Growth rates evolution,
– Markets, strategic, operative and technological risk-value drivers,
– Success probabilities to achieve certain targets,
– Start-up risks probabilities of success according to stage of development and sector,
– Etc.
Value at Risk is Used to Take Strategic Decisions
Value for Decision Making:
An advanced model is made to improve investment decisions by measuring and showing the impact of macro economic, market, strategic, technological & operative variables. Probabilistic and volatile driven scenarios allows management to take better strategic decisions where most big hits come from strategic business risks (as shown in the graph).
Downside and Upside Risk:
Downside risk is the probability of having a decline in the value of an investment or project if the market conditions change. On the contrary upside risk is the probability of having an increase of value if the market conditions change. Downside risk explains a worst case scenario for an investment or indicates how much the investor stands to lose. Advanced Valuations use different metrics to estimate the likelihood that an investment’s value will decline, including historical performance and standard deviation calculations based on our advanced models and forecasts.

The problem of the CAPM in Some Cases
Diversifiable risk is simply the risk that is specific to a particular security or sector so its impact on a diversified portfolio is limited.
The model takes into account the asset’s sensitivity to non-diversifiable risk (also known as systematic risk or market risk).
Specific Risks are not captured by the CAPM and portfolios that are not completely diversified (like private equities) cannot be well assessed by using CAPM alone. Therefore, we need advanced valuations to include specific risks in the stochastic forecasts (volatilities and probabilities).
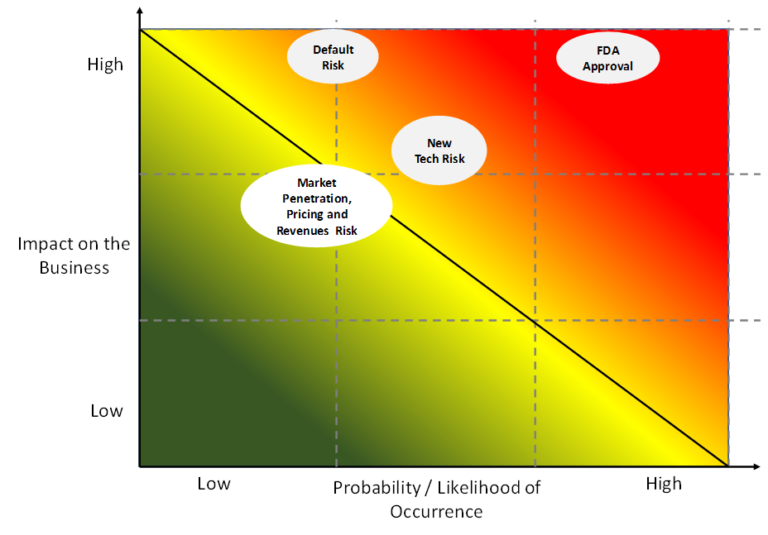
Some samples of specific Risks:-
-
-
-
- FDA approval risk for a Pharmaceutical firm.
- The volatility of commodities
- Probable increases or decreases in a company’s market share
- The probability of new entry and new technology
- Commercial Risks
- Technological Risks
- Operative Risks
- Etc
-
-
First Case: Biotech Start Up
We assess the value and the risk associated with a new globally patented biotechnology. Still two years needed for FDA approval (last two phases). The technology was developed by a team with an extensive and successful track record in research and development and the management is made by top executives coming from the biggest players in the industry. Consequently, the value is driven not only by the technology and its marketability but also by a very skilled, experienced and successful management team. Given that the technology is in the process of approval, we had to assess not only the market drivers but also the probabilities of success during the remaining stages of the FDA process. In addition, after FDA approval we have also considered the start-up default risk according to sector statistics.
Early Stage Risks and The Problem of CAPM in Traditional Models
- Traditional risk and return models (CAPM) that we use to estimate the cost of equity focus only on market risk, i.e., the risk that cannot be diversified away, based on the implicit assumption that the marginal investors in a company are diversified.
- The risks associated with investing in a young company include not only the traditional factors – earnings volatility and sensitivity to macroeconomic conditions, for example – but also the likelihood that the firm will not survive to make a run at commercial success.
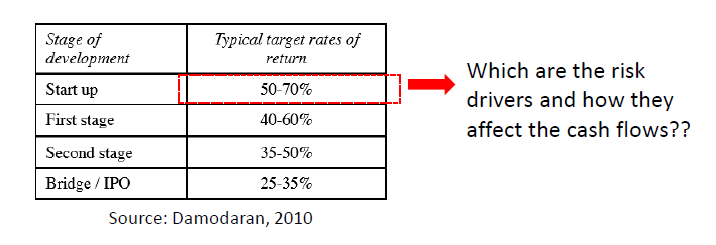
- When valuing private businesses, analysts often hike up discount rates to reflect all of the concerns that they have about the firm, including the likelihood that the firm will not make it. The table summarizes the target rates of return demanded by venture capitalists, categorized by how far along a firm is in the life cycle.
- The above method gives no information about the nature, magnitude, and flow of the risks affecting the forecast. All risks are included in a single discount rate.
The Risk Map is the First Step of an Advanced Valuation
The main scope of the risk-value mapping is to identify all those business factors affecting the value of the company. It is the starting point to understand and assess risk and value, and to prioritize the steps for improvement and development.
The risk-value mapping provides a more holistic understanding of the company itself. It complements the day-to-day monitoring of risks related to market, strategy, macro economics, operations and finance.
It also covers the overall approach to risks that have a more medium or long-term lifecycle (e.g. external risk).
The risk-value mapping is also necessary to understand the nature of each factor (Risk type and Risk profile) influencing the value of the company. Drivers are then assessed qualitatively and quantitatively. Each risk has its own profile in terms of frequency, volatility, standard deviation, regularity, persistence, probability, etc. The assessment will be made according to each profile and the inputs are taken from statistics and market studies.
DCF at Risk – Main Inputs and Drivers (1)


DCF at Risk – Main Inputs and Drivers (2)


DCF at Risk – Stochastic Outputs
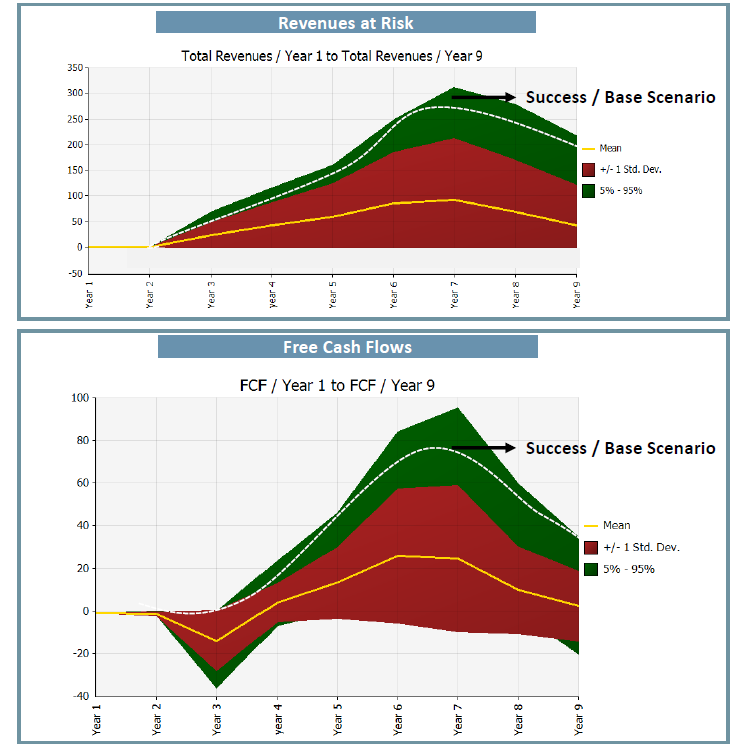
DCF at Risk – Value at Risk (VaR)

-
- 33.8% of having a value superior to the mean, being the mean 17.89 M 33.8% of having a value superior to the mean, being the mean 17.89 M
- 45% of having a value superior to zero
- 55% of having a negative value
-
The Mean Scenario should equal the output of a traditional and deterministic DCF (see next page).
- The negative values are driven by the probabilities of an unsuccessful trial and a possible default risk.
- The different positive values will depend on the appearance of a new technology and the commercial success in terms of market penetration.
- In this case, the investors will be able to see the magnitude and flow of each risk and can decide how to structure the deal.
- Investors will also be able to assess the probabilities they have to add value to their entry price. They will then decide which risks and probabilities they want to take.
Tornado Analysis
Tornado graphs from a sensitivity analysis display a ranking of the input distributions that impact an output. Inputs with the largest impact on the distribution of the output have the longest (and topmost) bars in the graph (Change in Output Mean). Samples for an input are grouped into a set of equal-sized bins, ranging from the input’s lowest value to its highest. A value for a statistic of the output (such as its mean) is calculated for the output values in the iterations associated with each bin. The length of the bar shown for each input distribution is based on the range of the highest statistic value for any bin to the lowest statistic value. The highest statistic value is plotted on one end of the bar and the lowest statistic value for any bin is plotted on the other end. These are “double-sided” tornado graphs, where each bar ranges above and below the baseline, or center, of the graph.

As shown in the tornado graphs, the main risk drivers (those with higher volatilities or higher probabilities of occurrence) are the probability of an unsuccessful trial, the appearance of a new technology and the default risk.
Derministic DCF with Adjusted WACC
Using a traditional deterministic DCF without considering specific risks as we did in our advance valuation, the forecast will look as shown in the table below. A successful scenario is used and it order to obtain the same mean of our advanced valuation, we have to use a discount rate of 68.5% (remember that in page 10 of this article we showed how VCs use discount rates between 50% and 70% for start-up companies.

Risk Profile: Standard Deviation, Kurtosis and Skewness

The project presents a Kurtosis of 6.42 which is relatively high (see red curves in the figure on the left). In the figure below, we position the project with other Investments. The higher the Kurtosis, the riskier the project. The project also shows a positive skewness of 1.83. The more negative the skewness, the longer its tail on left side (relative to the mean). The right side of the tail represents highest potential value. (see figure below) shows a high Kurtosis and a positive skewness.


For more information as how to interpret and use these figures, write us to: [email protected]
Why Advanced Valuations with Monte Carlo?

About the Author

Fernando Scarpati
Founder & Managing Partner of Business
Valuation International Ltd (BVint)
PhD in Valuation and Risk with more than 25 years in the Private Equity Sector and more than 500 valuations worldwide. He started his career in a top tier consulting firm continuing as Investment Director and Financial Service Director in important groups and PEs. He also holds an MBA, an Industrial Engineer degree and Bachelor’s degree in Economics and Business. As visiting Professor of business schools in Europe, he wrote many international articles in top financial journals and he is regularly interviewed and invited to speak at seminars and conferences. Fernando speaks fluent English, German, Italian and Spanish.
For more information about Advanced Valuations, write us to: [email protected]